Training Modules

18 Chapters
IsoSpeak Data Analysis and Visualization
Learn how IsoSpeak empowers users with the ability to explore their high dimensional functional data interactively.
Explore by Chapter
Explore by Chapter
CHAPTER 1
0:50
Getting Started
Explore your high dimensional functional data with IsoSpeak.
CHAPTER 2
0:57
Sample Validation using IsoQ Score
Analyze and validate cell sample quality using the IsoQ Score.
CHAPTER 3
1:01
Analytics Interface Overview
Navigate the user interface and customization options in IsoSpeak.
CHAPTER 4
1:07
Analytics Interface: Biomarker Analysis & Data Vizualization
Explore the data visualization options available in IsoSpeak.
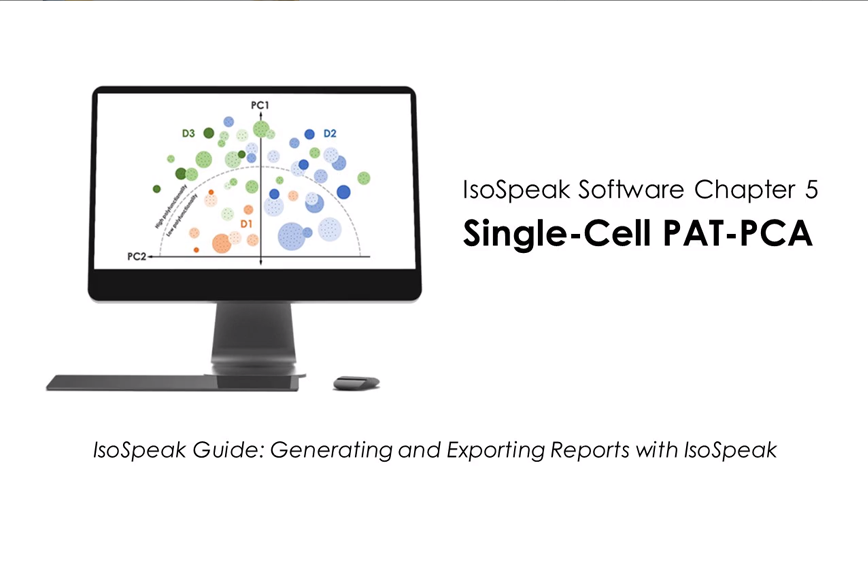
CHAPTER 5
1:22
Single Cell PAT-PCA
Generate and export a Single Cell PAT-PCA.
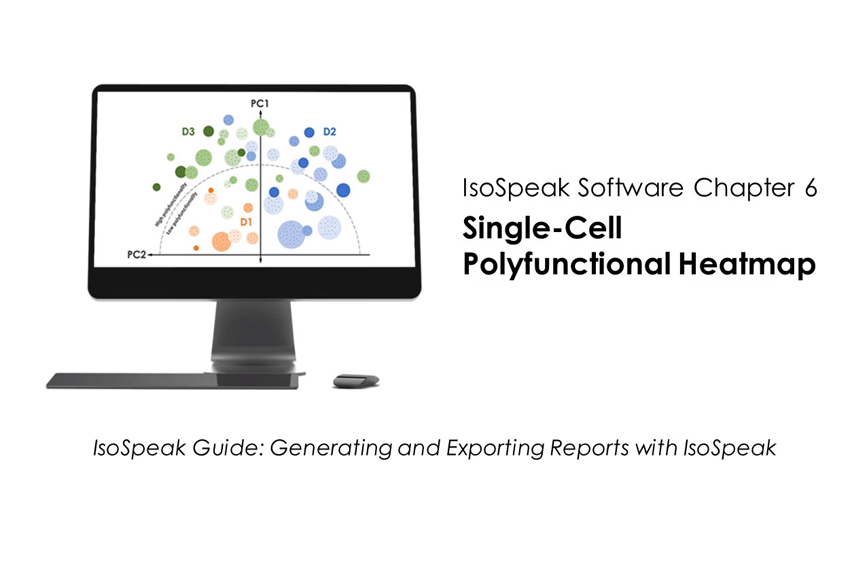
CHAPTER 6
1:11
Single-Cell Polyfunctional Heatmap
Generate and export a Single Cell Polyfunctional Heat Map.
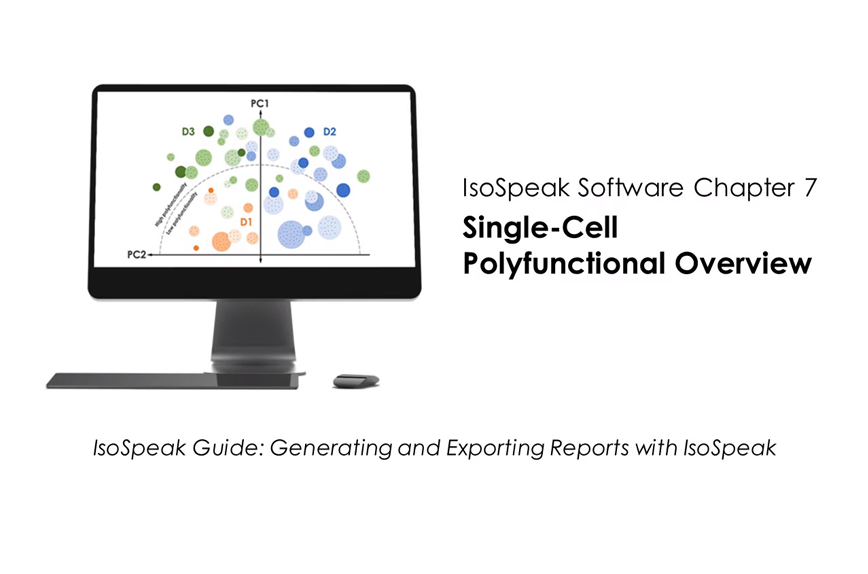
CHAPTER 7
1:12
Single-Cell Polyfunctional Overview
Generate and export a Single Cell Polyfunctional Overview.
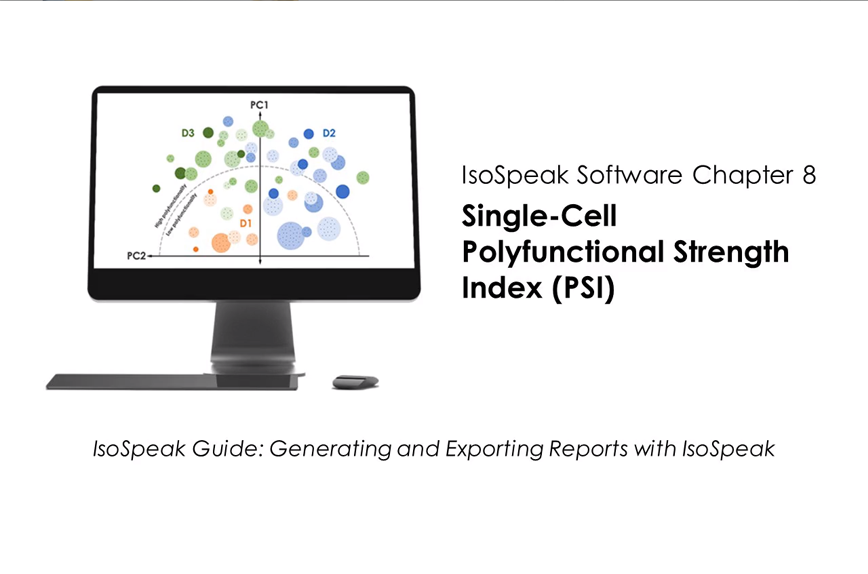
CHAPTER 8
1:21
Single-Cell Polyfunctional Strength Index (PSI)
Generate and export a Single Cell Polyfunctional Strength Index (PSI).
CHAPTER 9
1:17
Single-Cell Polyfunctional Strength Index Individual Cytokine Contribution
Generate and export a Single Cell Polyfunctional Strength Index (PSI) measuring individual cytokine contributions.
CHAPTER 10
3:20
Mapping 3D t-SNE
Generate and export a single cell polyfunctional 3D t-SNE for single cell mapping.
CHAPTER 11
2:21
Generating a 3D UMAP
Generate and export a 3D UMAP in IsoSpeak
CHAPTER 12A
1:23
Single-Cell Intracellular Proteome Visualizations, Part A: Signal Intensity Heatmap
Generate and export a signal intensity heatmap in IsoSpeak
CHAPTER 12B
1:23
Single-Cell Intracellular Proteome Visualizations, Part B: Signal Intensity Violin Plot
Generate and export a signal violin plot in IsoSpeak
CHAPTER 12C
1:18
Single-Cell Intracellular Proteome Visualizations, Part C: 2D t-SNE
Generate and export a 2D t-SNE in IsoSpeak
CHAPTER 12D
1:04
Single-Cell Intracellular Proteome Visualizations, Part D: Correlation Chord Diagram
Generate and export a correlation chord diagram in IsoSpeak
CHAPTER 13
0:56
Exporting Data
Exporting your IsoSpeak data
CHAPTER 14 Appendix
5:06
Field Guide - Scientific Support
Initiating scientific support from PhenomeX
CHAPTER 15 Appendix
5:17
Field Guide - Analyzing Your Data
Analyzing your data with IsoSpeak